Changing the Plot Region
In Stata, the area where the actual data appears is called the plot region and its elements are modified via the plotregion() twoway options (see help region_options).
Removing the Border
In some schemes, Stata outlines the top and right borders of the graph. To remove these, use
plotregion(lstyle(none))
| Border | No Border |
|---|---|
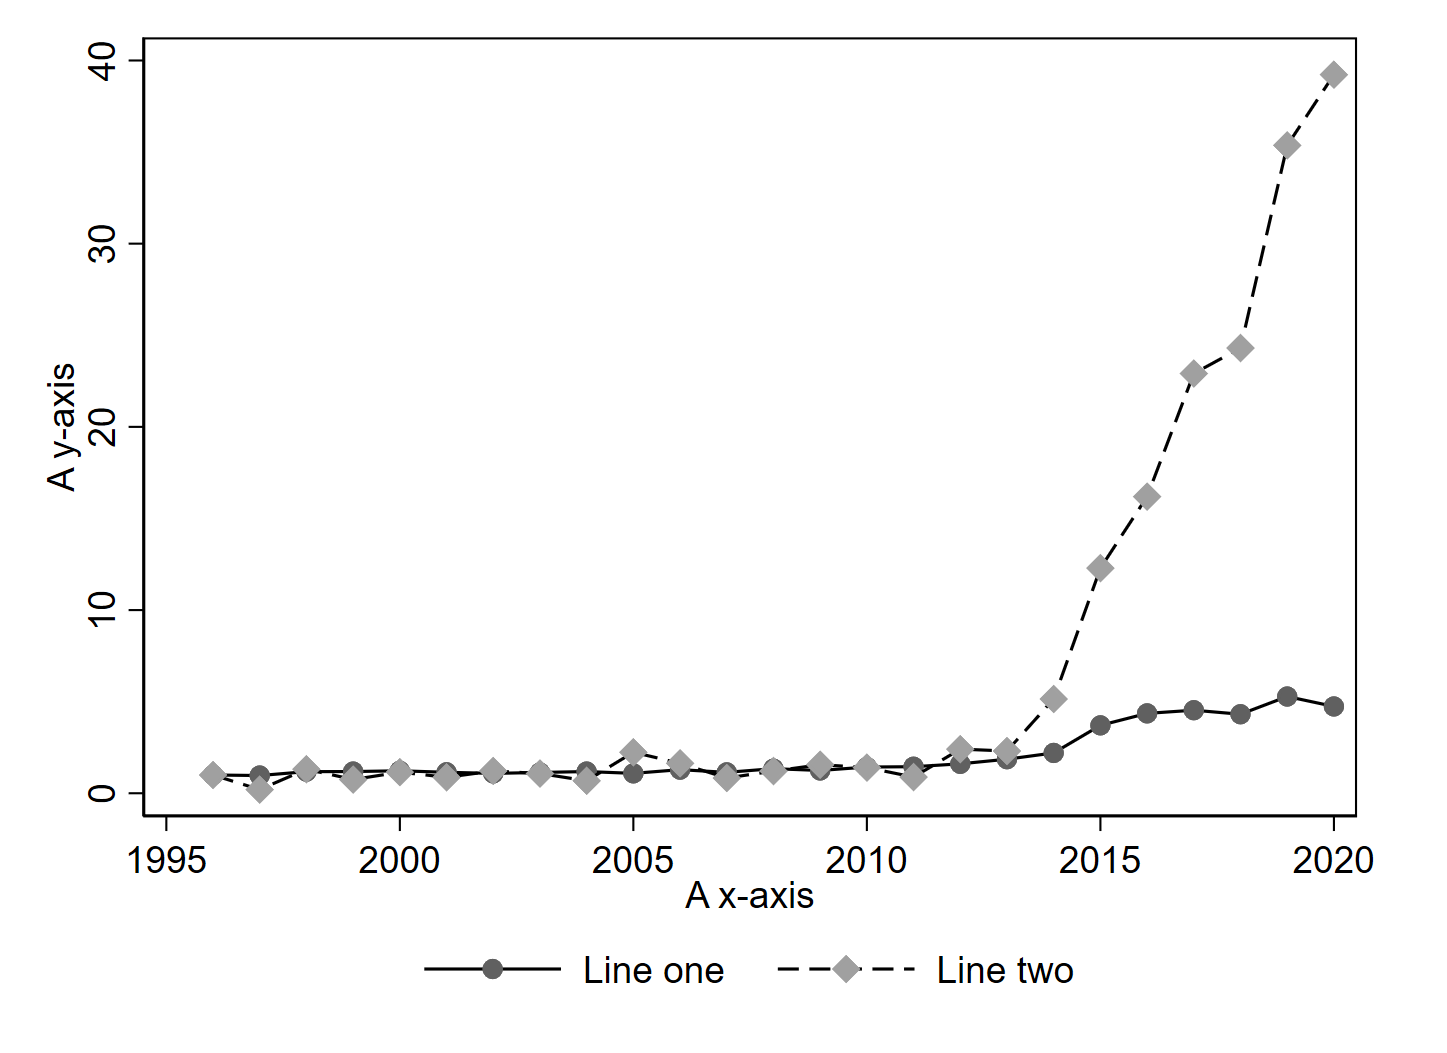 | 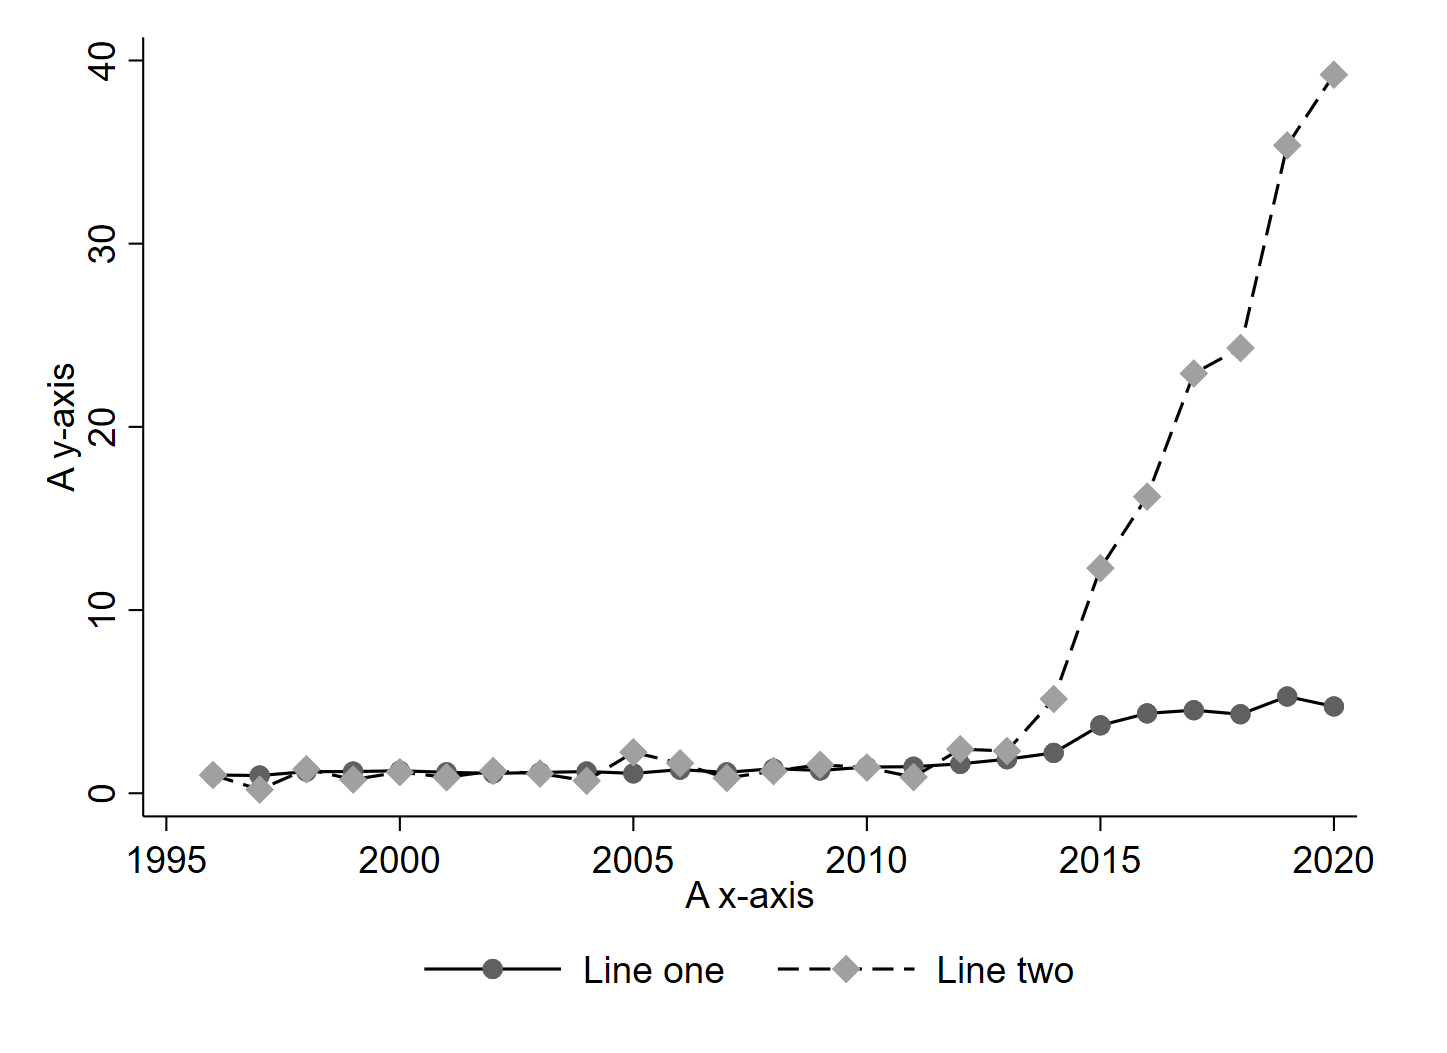 |
Extending the Plot Region
Sometimes, it is useful to extend the margins of the plot region to accomodate text, for instance. We can do this by editing the graph region via the margin() option (see help region_options)
In this case, I’m adding 17 units to the right margin of the graph region. There are many ways to specify this option, see help marginstyle.
graphregion(margin(r+17))
| Normal Margin | Extended Margin |
|---|---|
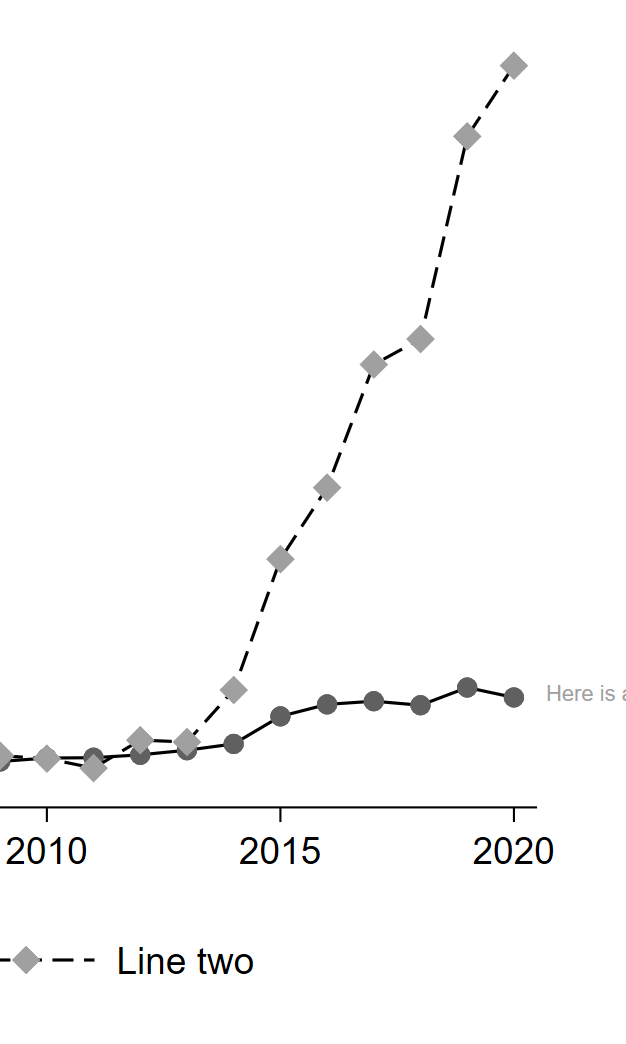 | 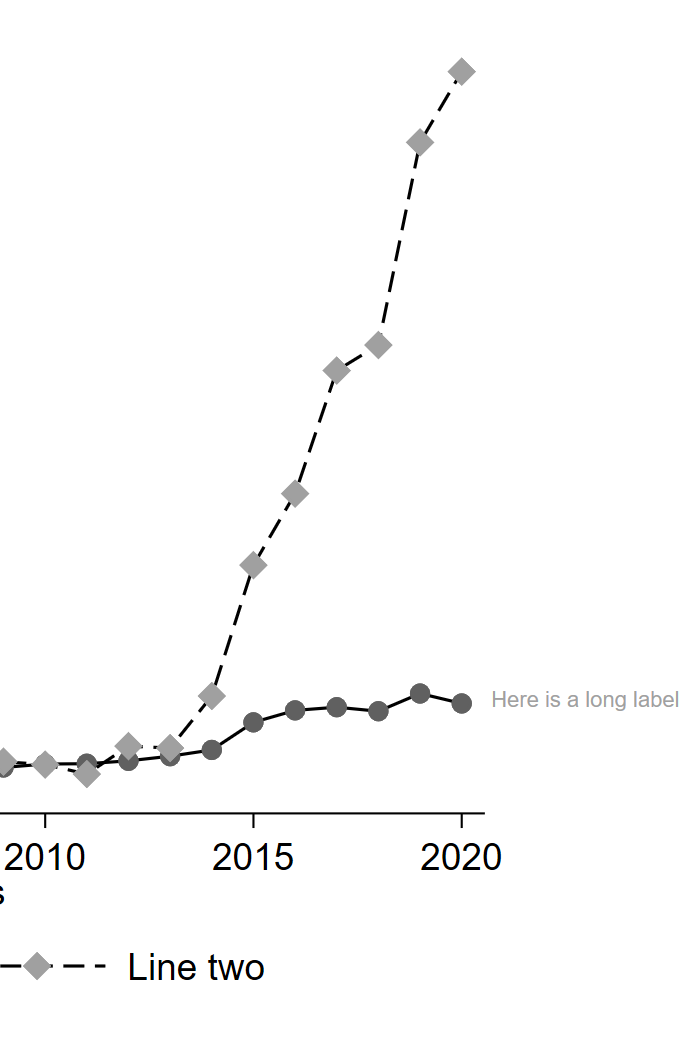 |